Tanglewood Catchment I&I Analysis
infiltration-inflowwastewater-collectioncatchment-analysisdata-driven-analyticssewer-network-monitoring
Tanglewood Catchment I&I Analysis
Authors: Inframark (no individual authors named) Year: 2026 (presentation dated March 10; event period Feb 10 – Mar 4, year not explicitly stated) Tags: inflow-and-infiltration, wastewater-collection, data-driven-analytics, catchment-analysis, utility-operations
TL;DR
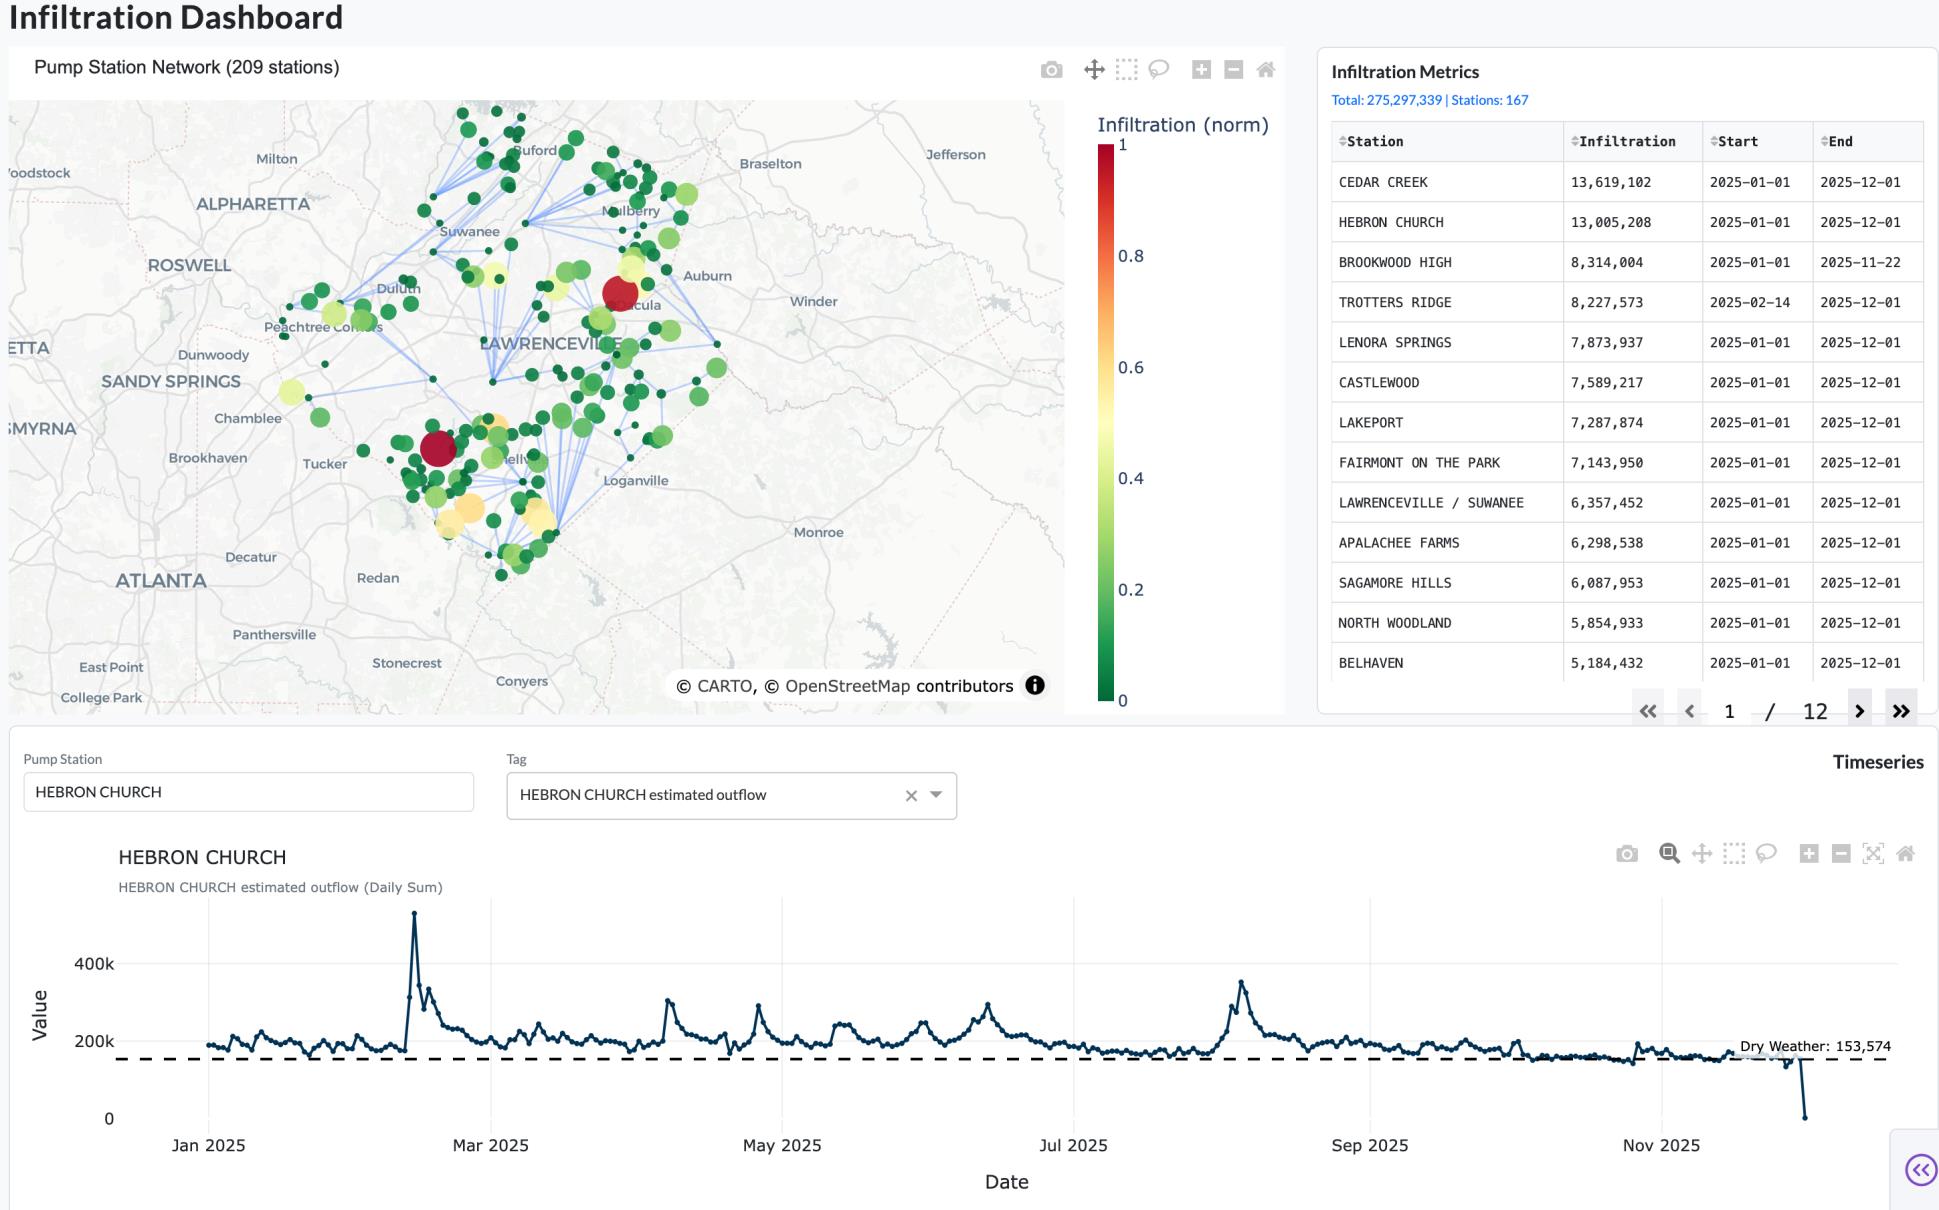
A slide-deck report applying data-driven I&I analytics to the Tanglewood subcatchment of the Gwinnett sewer network to isolate pipe segments with disproportionate infiltration loads. Two sites (Site 6 and Site 9) account for the largest infiltration volumes — 336.03 MG and 377.01 MG respectively over a 22-day wet-weather event — and a near-real-time dashboard is proposed to support ongoing monitoring.
First pass — the five C's
Category. Practitioner analysis report / operational case study (not a peer-reviewed research paper).
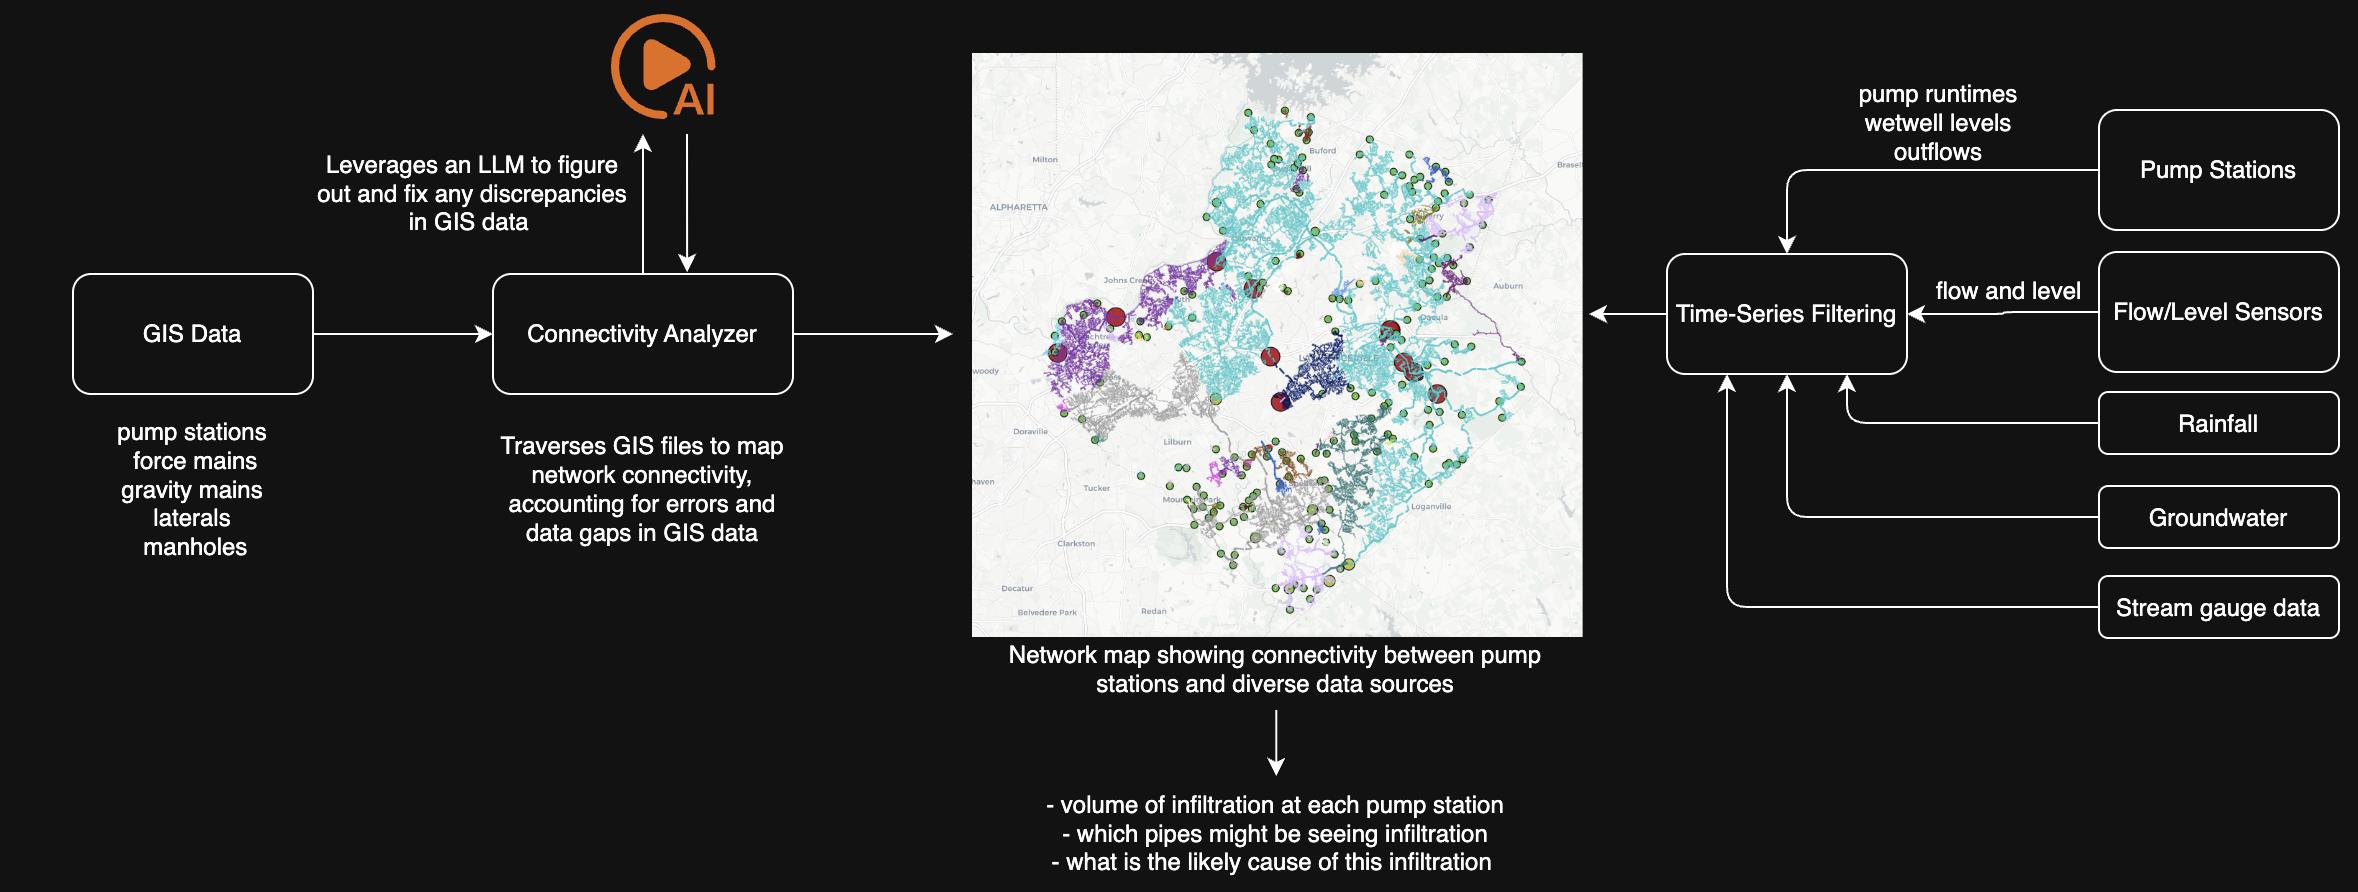
Context. Utility operations subfield; builds on standard I&I characterization practice (groundwater infiltration, RDII, diurnal pattern separation at pump-station level). No prior works or external citations are named in the document.
Correctness. Load-bearing assumptions: (1) flow data at monitoring sites accurately represents infiltration attributable to upstream pipe segments; (2) per-mile normalization is meaningful despite unknown pipe age, diameter, and condition distribution; (3) the ~70% area-reduction claim follows logically from narrowing ~20 miles to ~6.4 miles, though the denominator of the reduction is not explicitly defined.
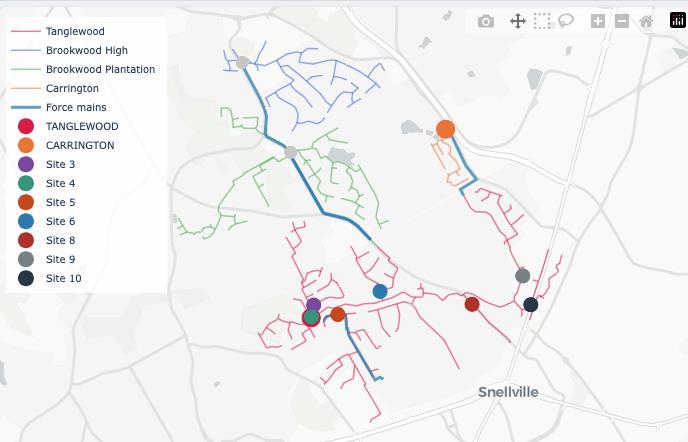
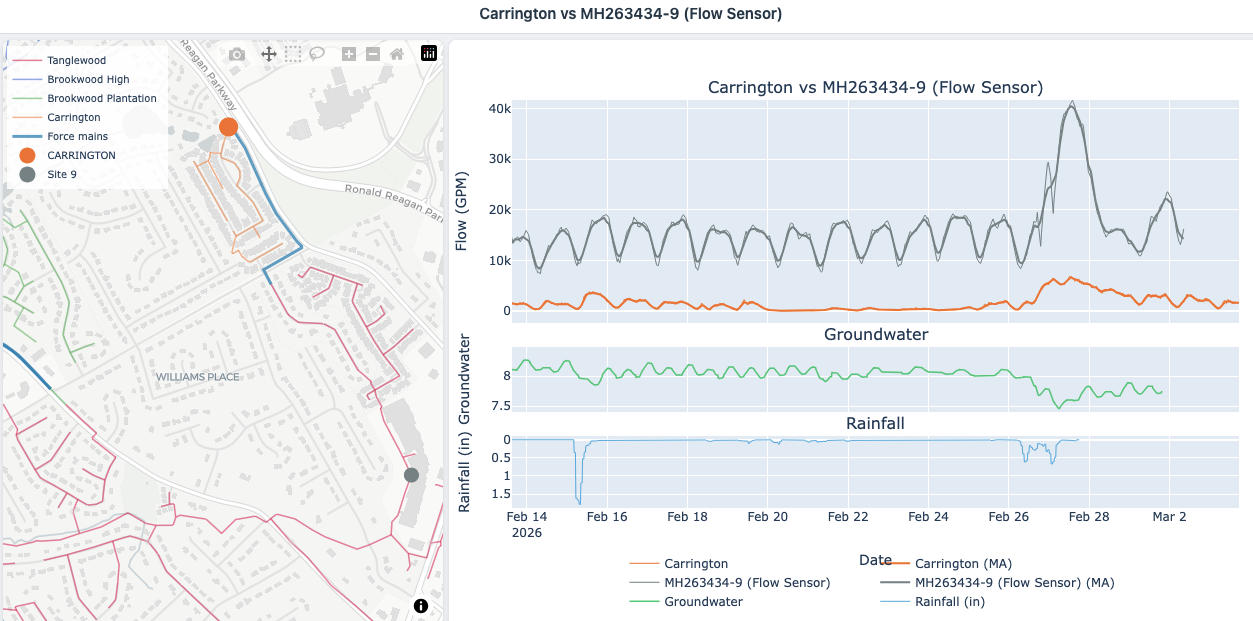
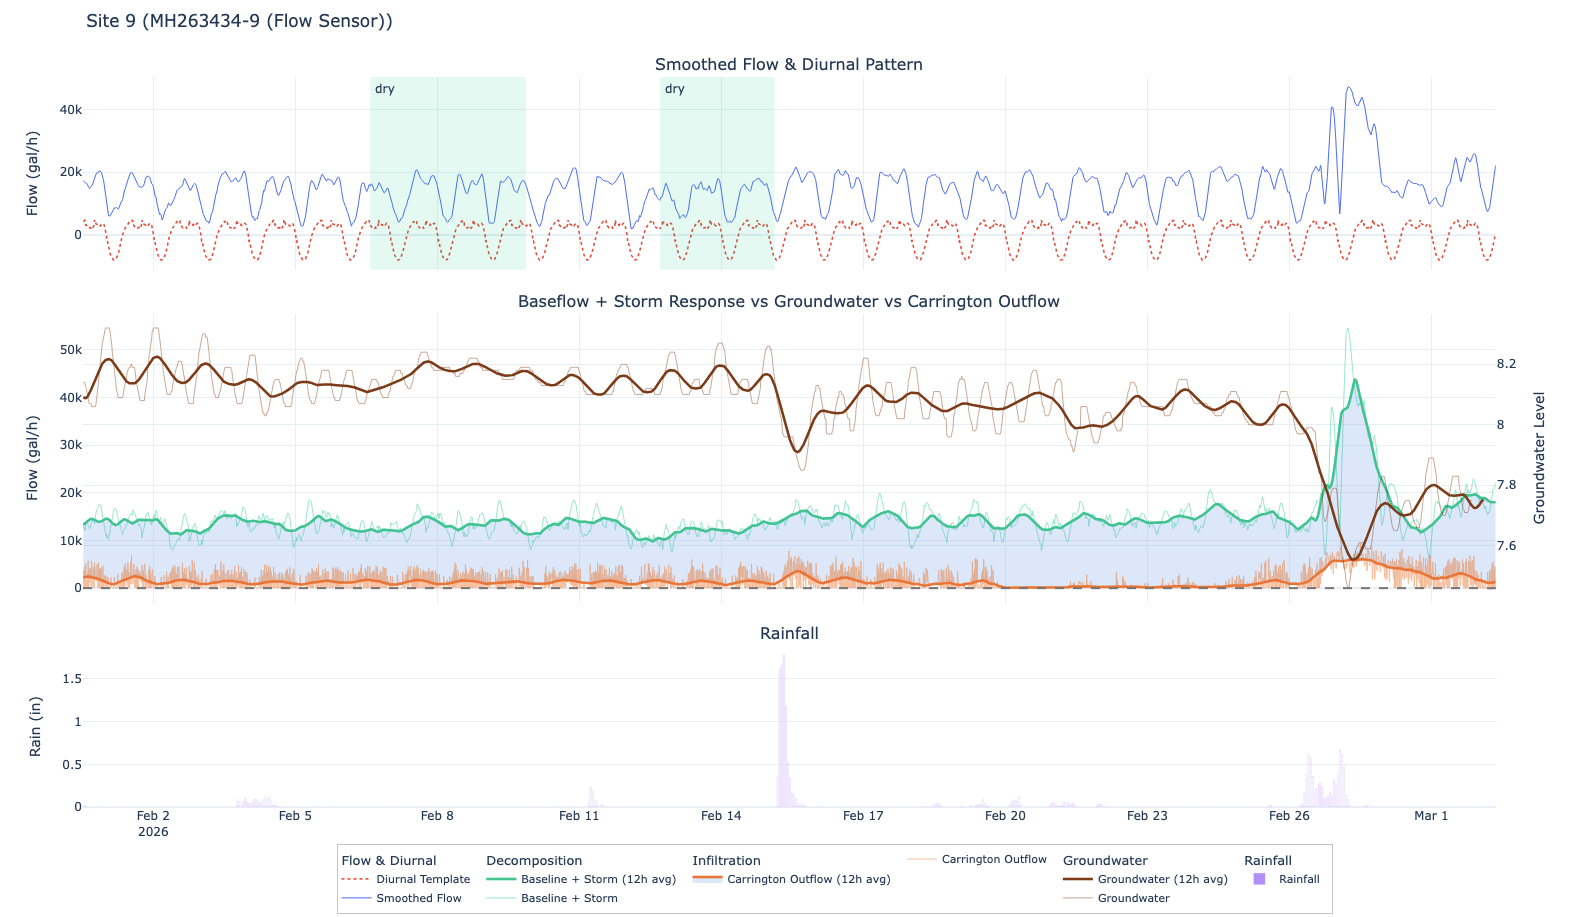
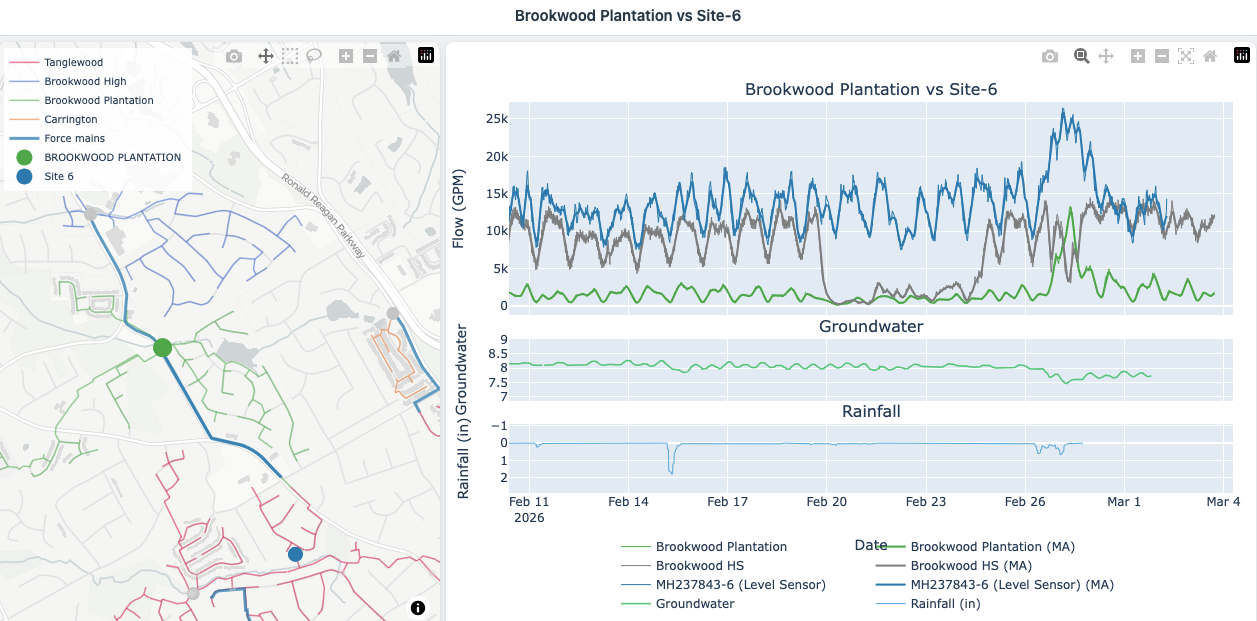
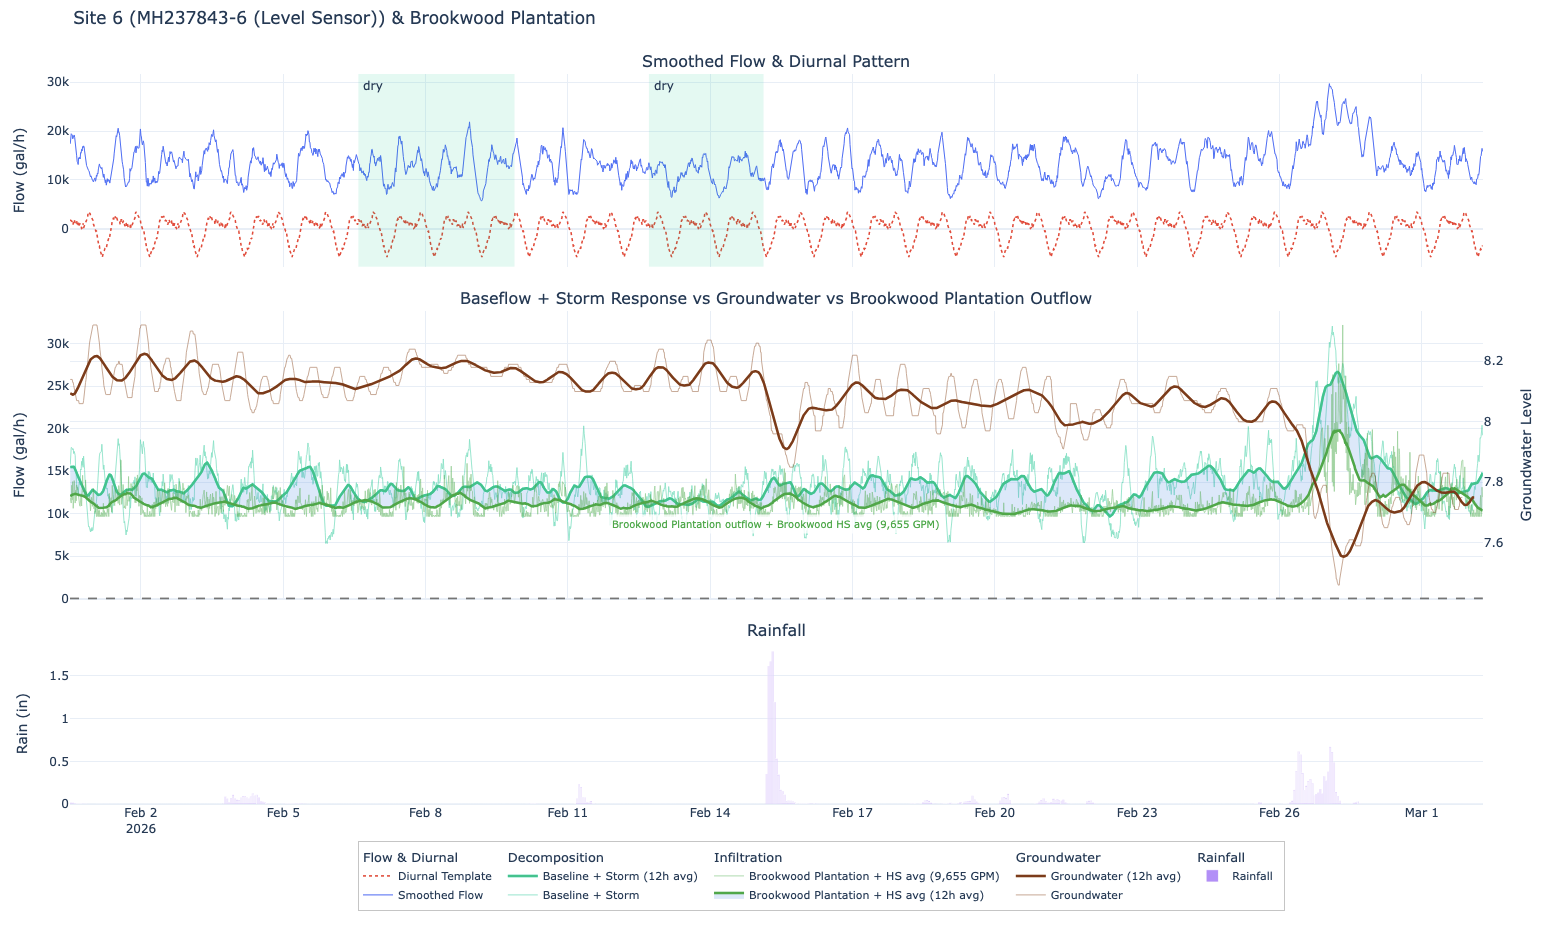
Contributions. - Spatial isolation of two high-priority sub-areas (Carrington/Site 9: ~1.4 miles; Brookwood/Site 6: ~5.0 miles) from a 20-mile catchment using flow monitoring data. - Per-mile infiltration intensity metric: Site 9 = 269.293 MG/mile; Site 6 = 67.206 MG/mile for the Feb 10 – Mar 4 event. - Near-real-time I&I dashboard enabling ongoing detection and response.
Clarity. Document is a sparse slide deck with bullet points and figures; methodology steps are referenced but not described in sufficient detail for independent replication.
Second pass — content
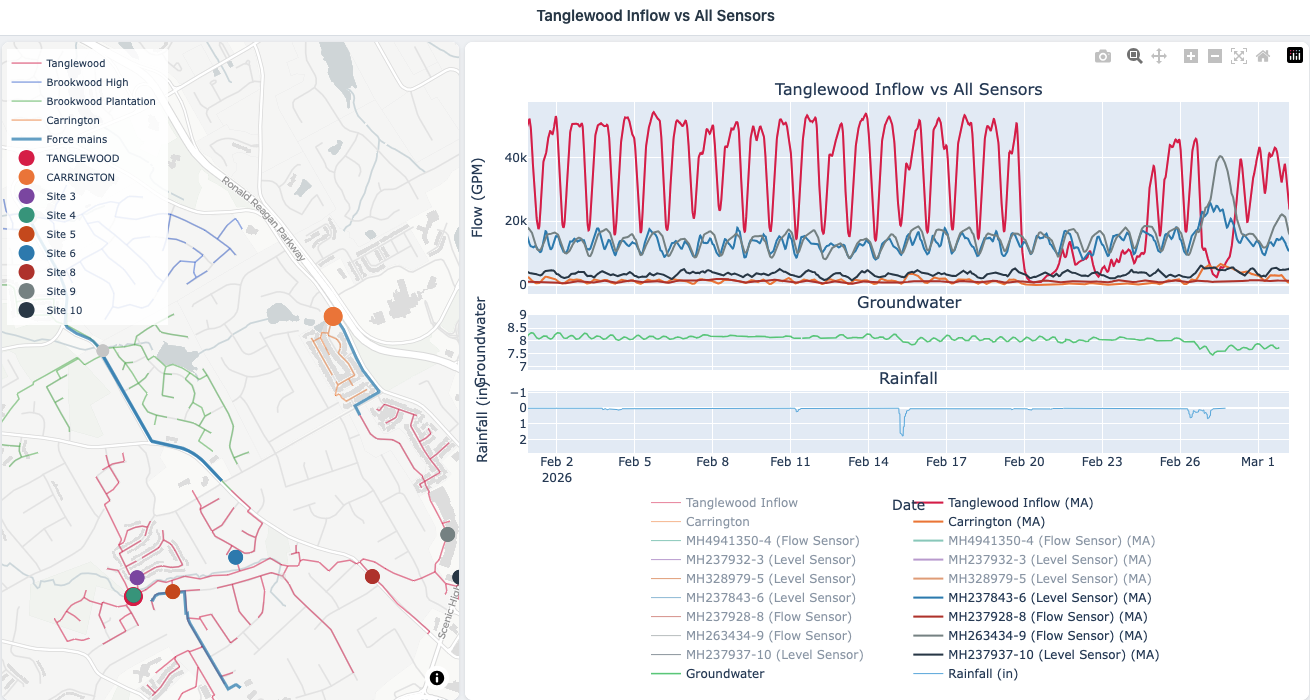
Main thrust: Flow monitoring at six sites within the 20-mile Tanglewood catchment during a 22-day wet-weather event identifies Site 9 (Carrington, ~1.4 miles) and Site 6 (Brookwood, ~5.0 miles) as the dominant infiltration sources, reducing the pipe length requiring physical investigation by approximately 70%.
Supporting evidence: - Infiltration volumes Feb 10 – Mar 4: Site 2 = 14.44 MG, Site 8 = 25.17 MG, Site 1 = 31.97 MG, Site 10 = 87.10 MG, Site 6 = 336.03 MG, Site 9 = 377.01 MG. - Per-mile intensity: Site 9 = 269.293 MG/mile; Site 6 = 67.206 MG/mile. - Investigation area narrowed from ~20 miles to ~6.4 miles (~1.4 + ~5.0 miles), claimed ~70% reduction. - Gwinnett network context: ~3,052 total miles; Tanglewood = ~20 miles (~0.66% of system).
Figures & tables: Document references site-level event plots for Site 9 (Carrington) and Site 6 (Brookwood) and an I&I dashboard; axis labels, units, error bars, confidence intervals, and statistical significance are not visible or described in the provided text. Visualization quality cannot be assessed from the text alone.
Follow-up references: Not stated. No external citations are provided in the document.
Third pass — critique
Implicit assumptions: - Monitoring sites form a clean, non-overlapping spatial hierarchy such that volumes can be attributed solely to the intervening pipe segment — not stated or validated. - Per-mile normalization assumes uniform pipe characteristics (diameter, age, material) within each sub-area; violations would invalidate relative intensity comparisons. - The 22-day event is treated as representative; a single wet-weather event may not capture dry-weather base infiltration or seasonal variability. - "~70% reduction" denominator is ambiguous — unclear whether it is 20 miles, total Gwinnett mileage, or some other baseline.
Missing context or citations: - No comparison to NASSCO, EPA, or industry-standard I&I thresholds or benchmarks. - No description of the flow-monitoring instrumentation, sensor accuracy, or data-quality checks. - No engagement with alternative diagnostic methods (smoke testing, CCTV, dye testing) or how this workflow compares in cost or accuracy. - The analytical methodology for separating groundwater infiltration, RDII, and diurnal patterns is referenced but not described.
Possible experimental / analytical issues: - Single-event analysis: results may not generalize to other storm magnitudes, antecedent soil moisture conditions, or dry seasons. - No uncertainty quantification on volume estimates; meter accuracy and data gaps are not discussed. - The ~1.4-mile and ~5.0-mile sub-areas are identified as "pipes for analysis" but the selection criteria are not explained — potential for confirmation bias if sites were pre-selected. - No statistical significance or confidence intervals are reported for any estimate. - Dashboard described qualitatively; no validation of near-real-time detection accuracy is provided.
Ideas for future work: - Replicate analysis across multiple storm events of varying intensities to assess whether Site 9 and Site 6 consistently dominate or whether ranking shifts. - Integrate pipe-attribute data (age, material, diameter, depth) to build a regression model predicting infiltration intensity per segment, enabling network-wide prioritization without full metering. - Conduct field verification (CCTV, smoke testing) within the identified ~6.4-mile priority zone and report correlation between predicted and observed defect locations. - Extend the per-mile metric to the full Gwinnett 3,052-mile system to validate whether a similarly small fraction of pipe length accounts for a disproportionate share of total I&I volume (Pareto distribution hypothesis).
Figures from the paper
Methods
- I&I analysis workflow
- infiltration volume estimation per mile
- RDII isolation
- diurnal pattern analysis
- near-real-time dashboard monitoring
- data-driven pipe segment prioritization
Datasets
- Gwinnett County sewer network flow data (~3052 miles)
- Tanglewood catchment flow monitoring data (~20 miles)
- Site-level flow data (Sites 1, 2, 6, 8, 9, 10) for Feb 10 – Mar 4 event
Claims
- The I&I analysis workflow reduced the investigation area by approximately 70%, enabling faster and more focused field assessments.
- The workflow successfully isolates groundwater infiltration, rainfall-derived inflow and infiltration (RDII), and diurnal patterns at the pump-station level.
- Site 9 (Carrington) exhibited a disproportionately high infiltration rate of 269.293 MG/mile compared to Site 6 (Brookwood) at 67.206 MG/mile during the analysis period.
- Applying this approach system-wide can identify high-priority pipe segments contributing disproportionate infiltration loads.
- A near-real-time I&I dashboard improves monitoring, supports decision-making, and enhances detection and response to I&I events.