Baseflow Separation Using the Digital Filter Method: Review and Sensitivity Analysis
[doi] baseflow-separationdigital-filterstreamflowhydrologysensitivity-analysis
Baseflow Separation Using the Digital Filter Method: Review and Sensitivity Analysis
Authors: Taeuk Kang, Sangho Lee, Namjoo Lee, Youngkyu Jin Year: 2022 Tags: baseflow-separation, digital-filter, sensitivity-analysis, baseflow-index, streamflow, hydrograph-analysis
TL;DR
Four single-parameter digital filter baseflow separation methods (Lyne–Hollick, Chapman, Chapman–Maxwell, EWMA) are systematically evaluated across 25 Korean gauging stations using condition-number sensitivity analysis. Chapman and CM methods fail to reproduce the recession curve during dry seasons; EWMA (α: 0.012–0.015) and LH (α: 0.950–0.975) are recommended as reliable alternatives. The study provides the first comprehensive cross-method sensitivity analysis linking filter parameter sensitivity to watershed flow-variability metrics.
First pass — the five C's
Category. Evaluation/comparative study with sensitivity analysis and practical parameter recommendations applied to real streamflow records.
Context. Hydrological baseflow separation subfield; builds directly on Lyne & Hollick [13] (original digital filter), Chapman [18] (critique and revision of LH), Chapman & Maxwell [19] (recession-constant-based filter), and Tularam & Ilahee [20] (EWMA method). Eckhardt [17, 23] is cited for context on two-parameter methods and recession constants but not included in the comparison.
Correctness. Load-bearing assumption: baseflow = low-frequency component of the streamflow signal, making digital filtering a valid separation proxy. This is explicitly acknowledged to have no physical basis. A second key assumption is that visual fit to the recession curve during dry seasons constitutes a valid adequacy criterion, which is subjective and not validated against an independent ground-truth estimate (tracer, lysimeter, etc.).
Contributions. - First systematic, cross-method sensitivity analysis using condition numbers (CN) for four single-parameter digital filter methods over 25 stations with diverse river regimes. - Introduces dimensionless variation (QDi,Dj) between flow-duration-curve quantiles as a robust, extreme-flow-insensitive watershed characteristic for relating BFI sensitivity to catchment behavior. - Documents a systematic failure of the Chapman and CM methods to reproduce the recession curve during dry seasons across all parameter values tested. - Proposes specific recommended parameter ranges: EWMA α ∈ [0.012, 0.015]; LH α ∈ [0.950, 0.975]; Chapman and CM deemed unsuitable.
Clarity. Generally readable, though the dual use of "Table 6" (once for condition numbers and once labeled "appropriate parameter estimation" in the text, actually Table 7 in the PDF) creates minor confusion; terminology is consistent and equations are clearly presented.
Second pass — content
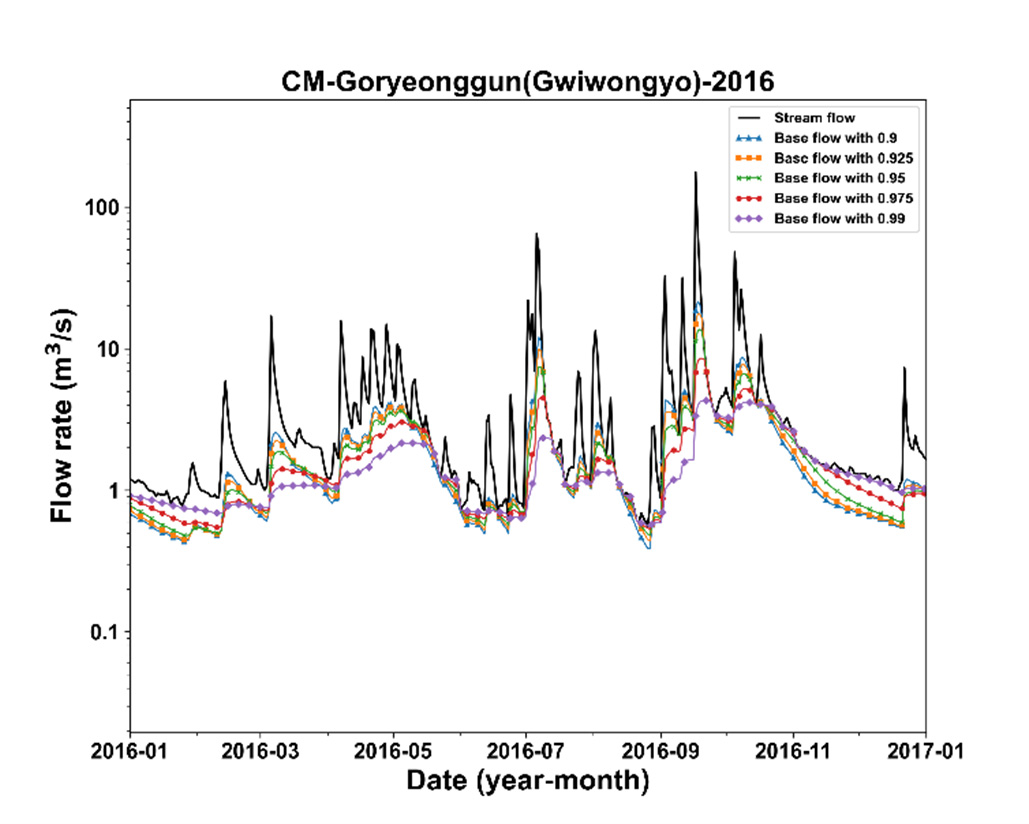
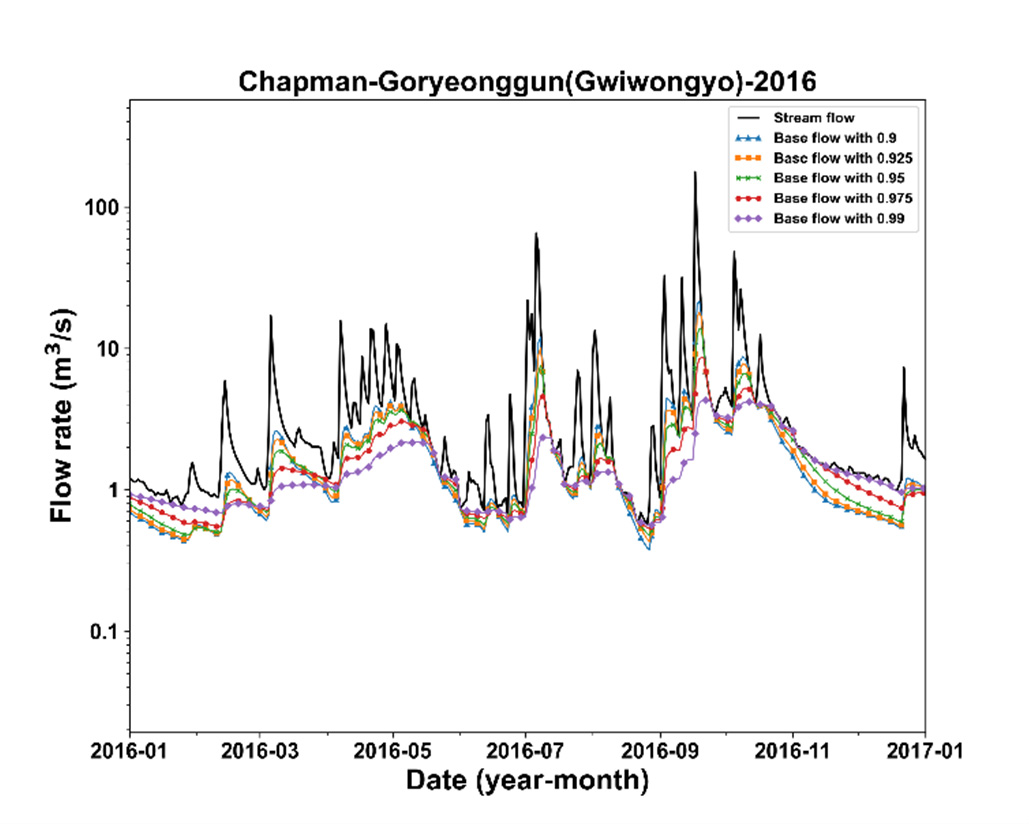
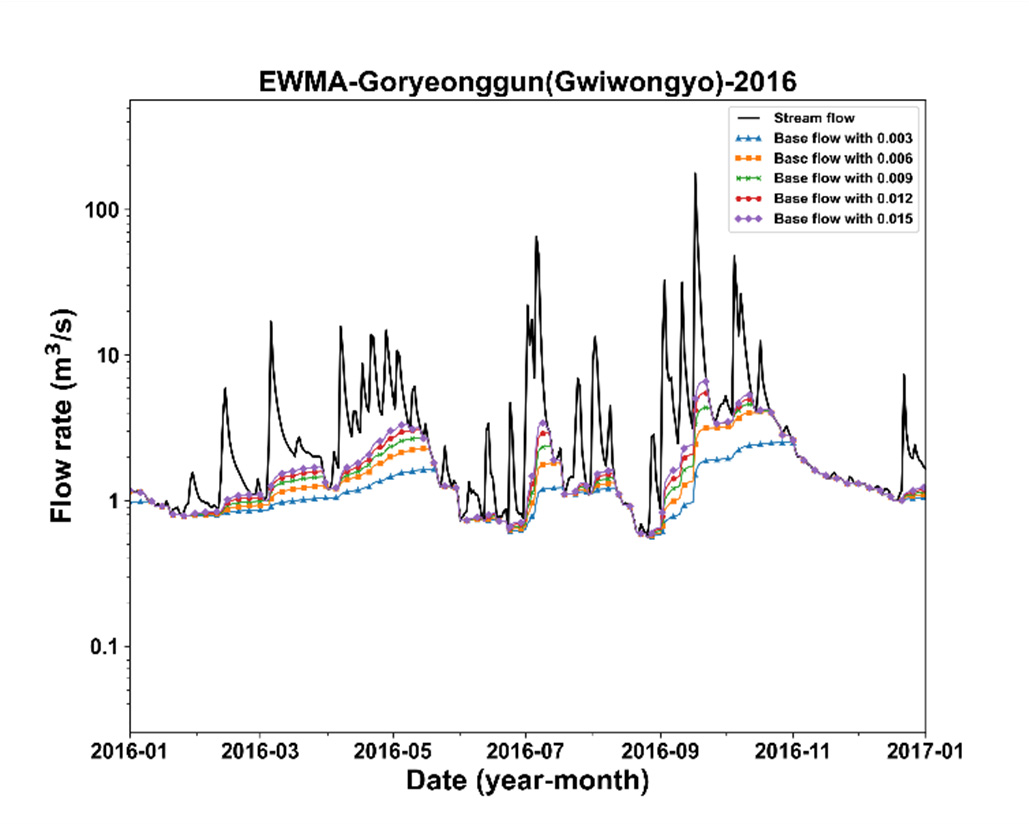
Main thrust: Among four single-parameter digital filter methods applied to Korean rivers, Chapman and CM systematically over-separate or misrepresent baseflow during dry seasons regardless of parameter choice, while EWMA and LH achieve reliable separation within narrow, identifiable parameter ranges; sensitivity to parameter variation is itself a function of watershed flow variability.
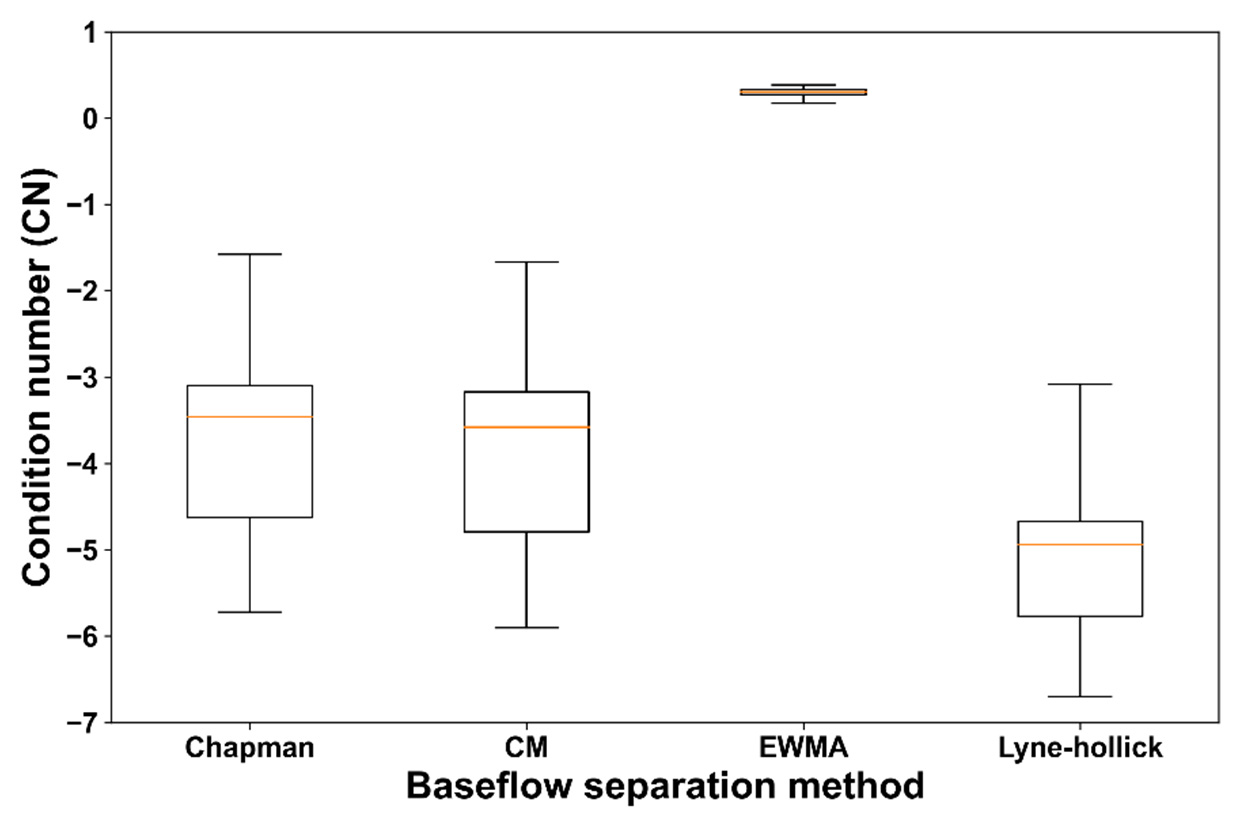
Supporting evidence: - BFI correlation with dimensionless variation QD1,D9: EWMA r = −0.813 (very high), LH r = −0.726 (high), Chapman r = −0.618 (high), CM r = −0.617 (high); all negative, indicating higher flow variability → lower BFI. - Condition numbers for LH: −3.08 to −6.70 across stations (most sensitive method); EWMA: +0.17 to +0.38 (least sensitive, smallest inter-station deviation). - Chapman and CM condition numbers fall between these extremes: −1.58 to −5.72 and −1.67 to −5.90, respectively. - 25 stations span drainage areas 92.16–2990.66 km² and river regime coefficients 88–1792, providing diverse test conditions. - Recommended parameter ranges derived from visual evaluation: EWMA α ∈ [0.012, 0.015]; LH α ∈ [0.950, 0.975]; no usable parameter range found for Chapman or CM.
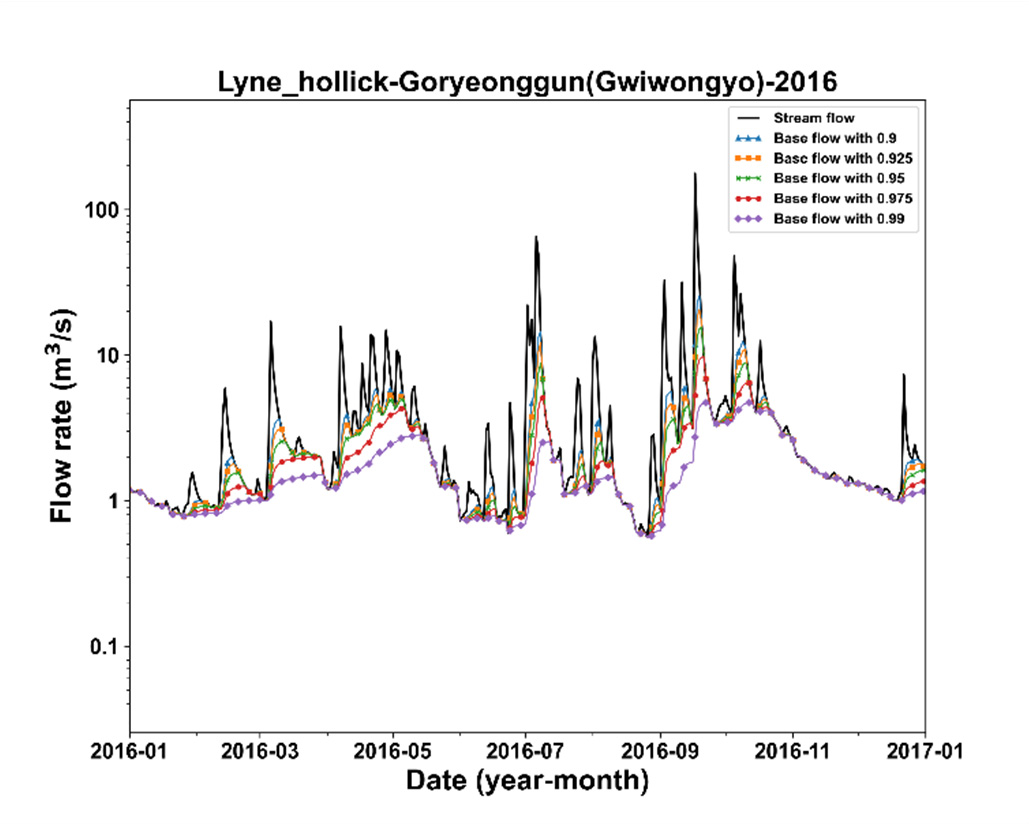
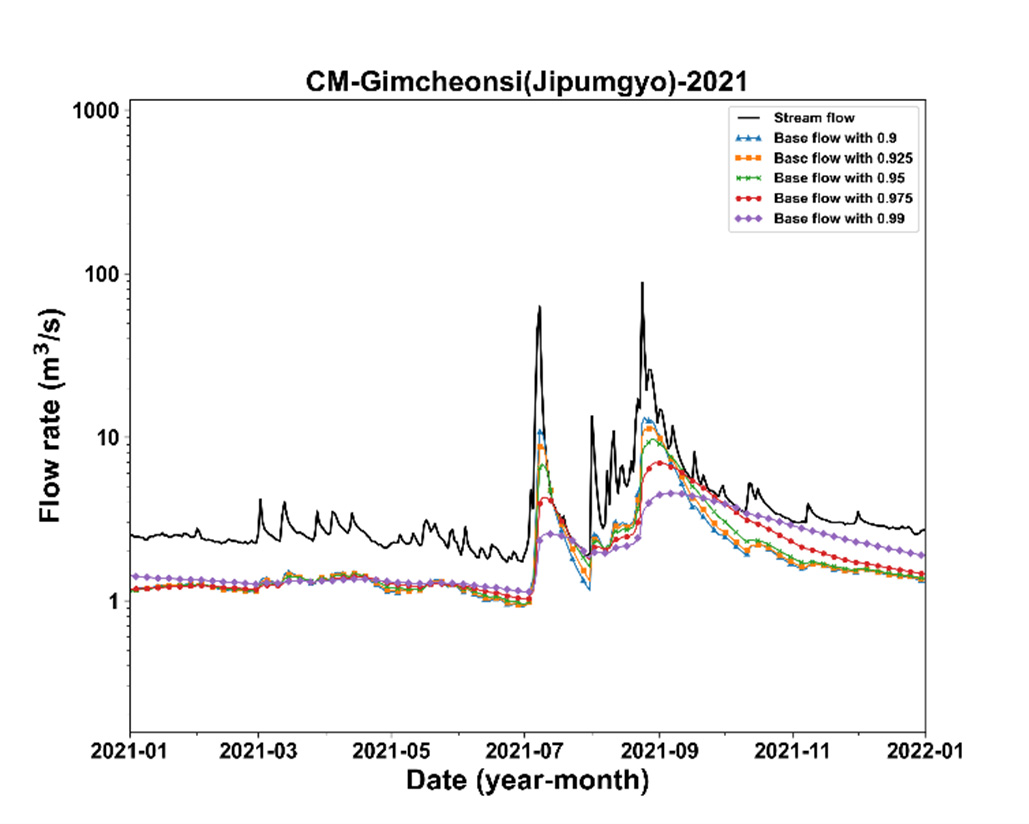
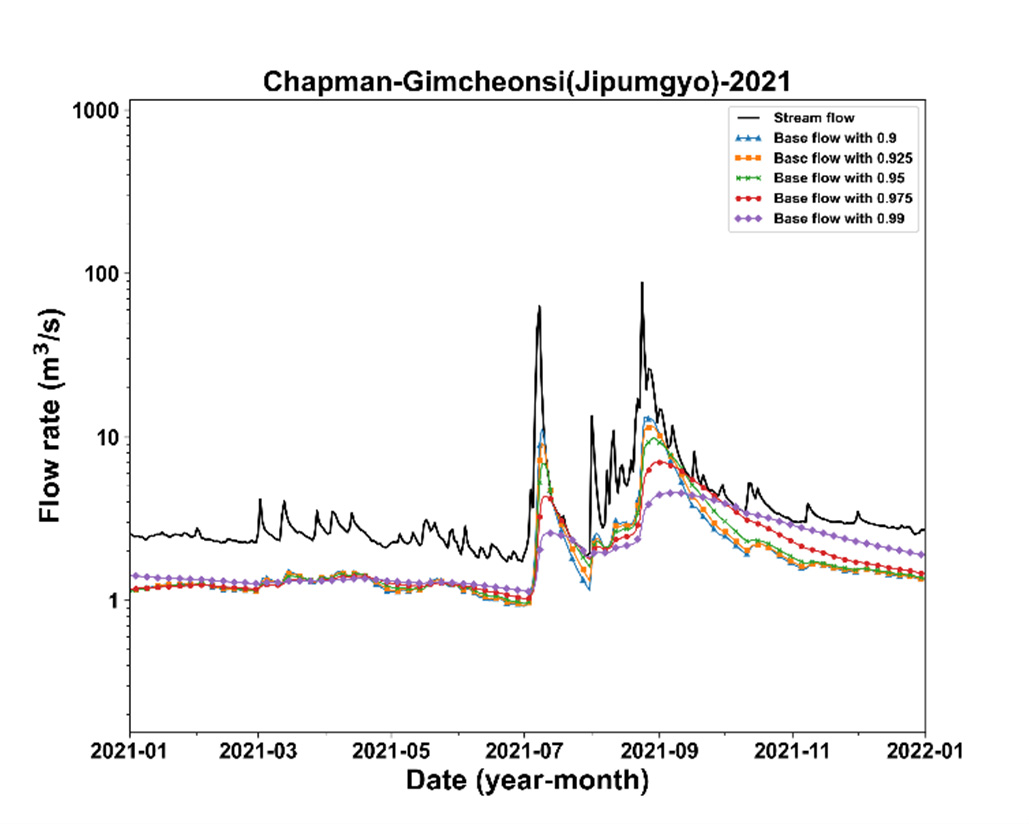
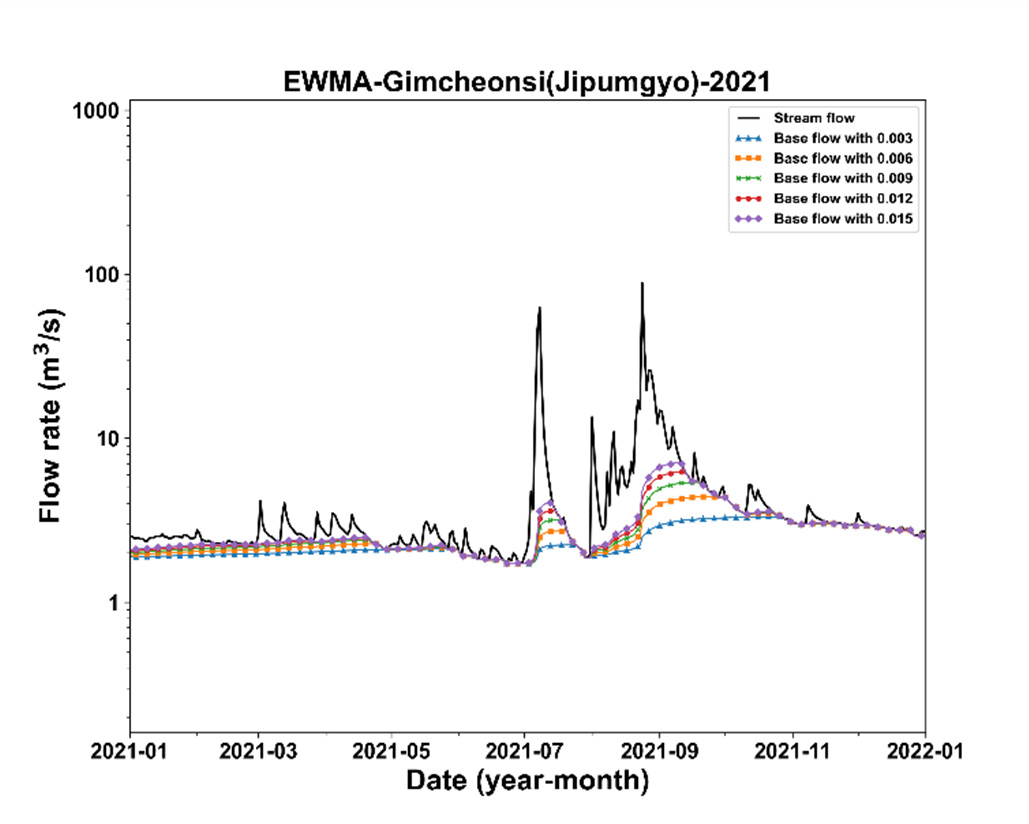
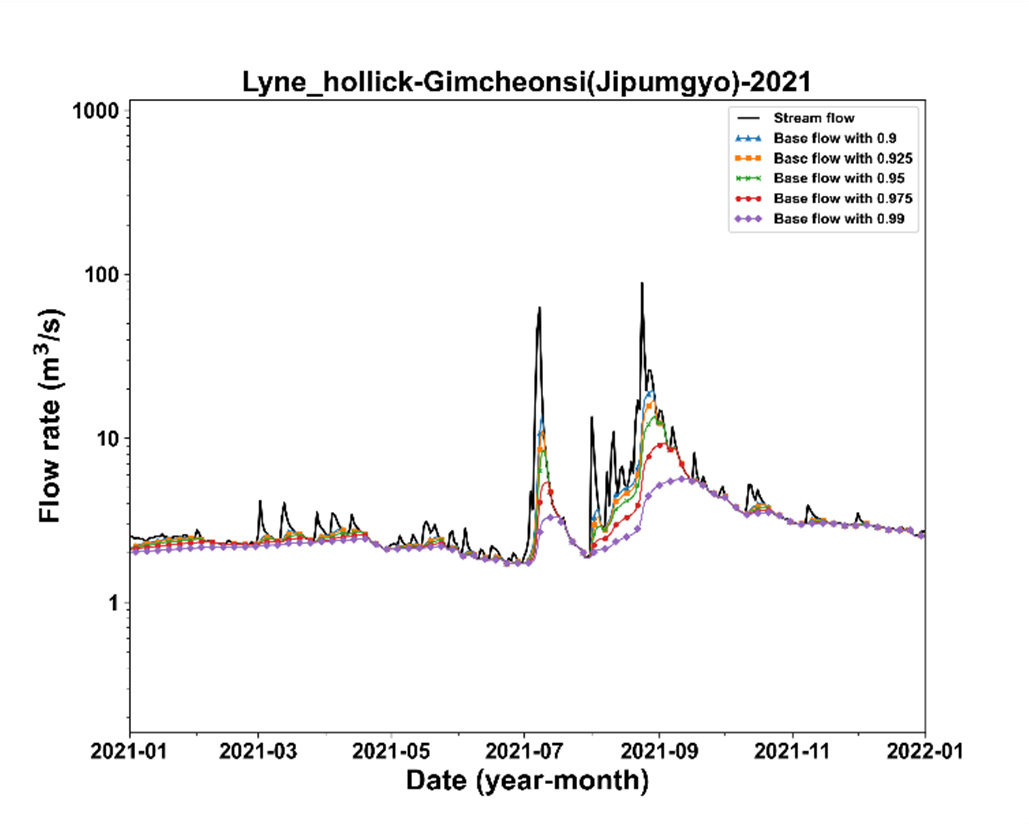
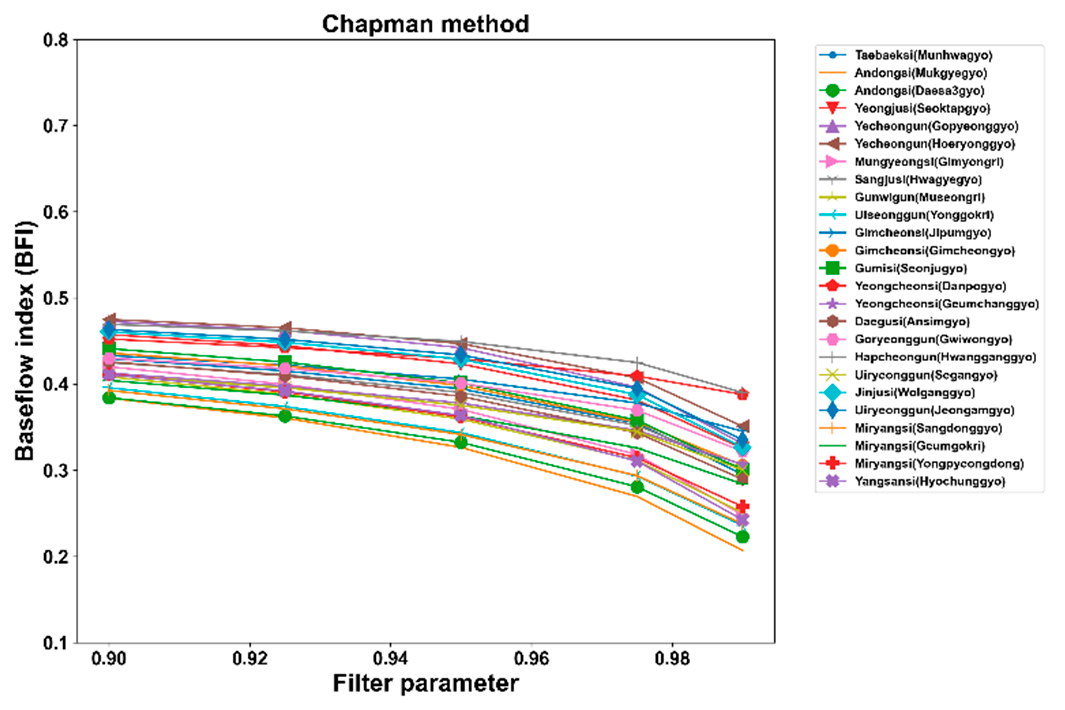
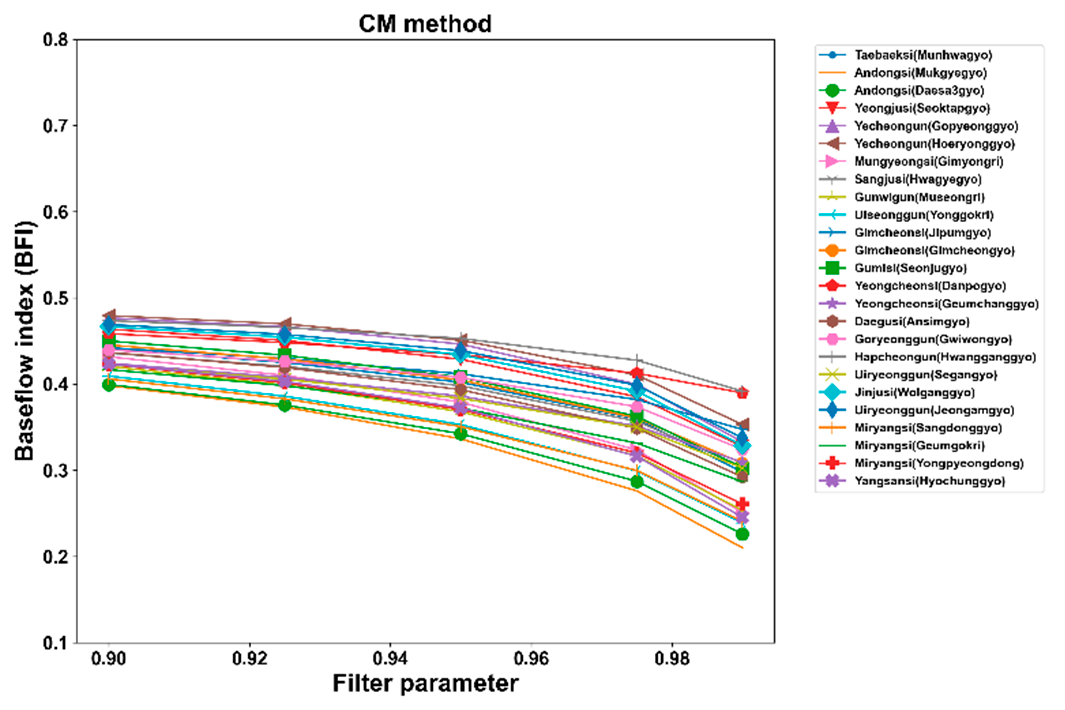
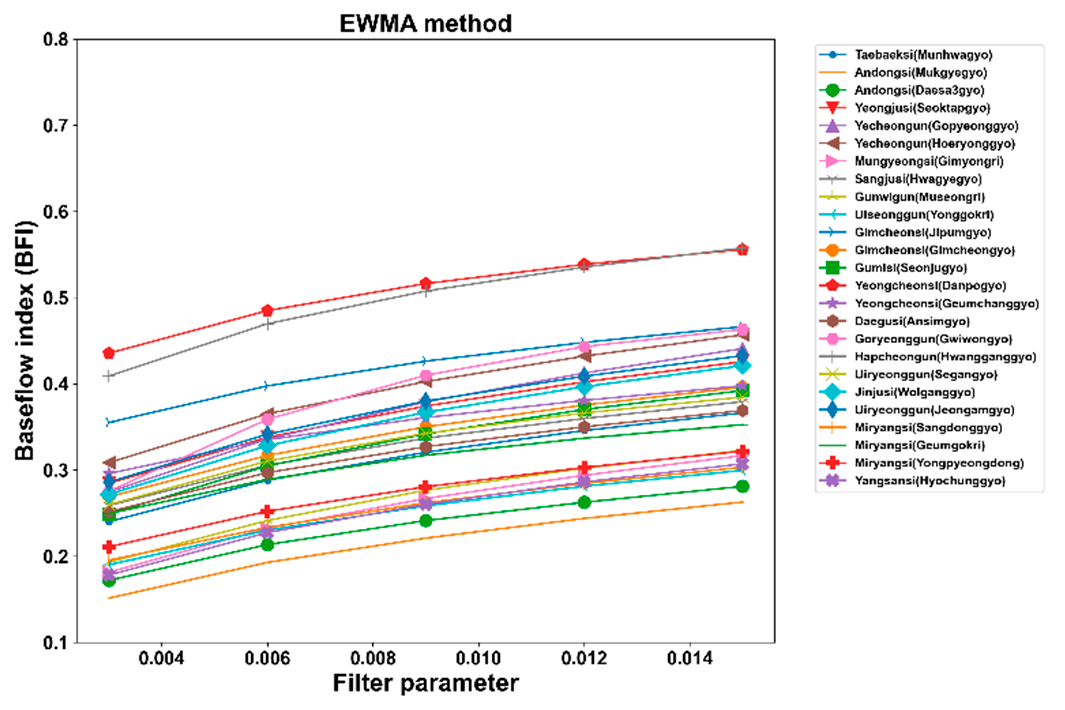
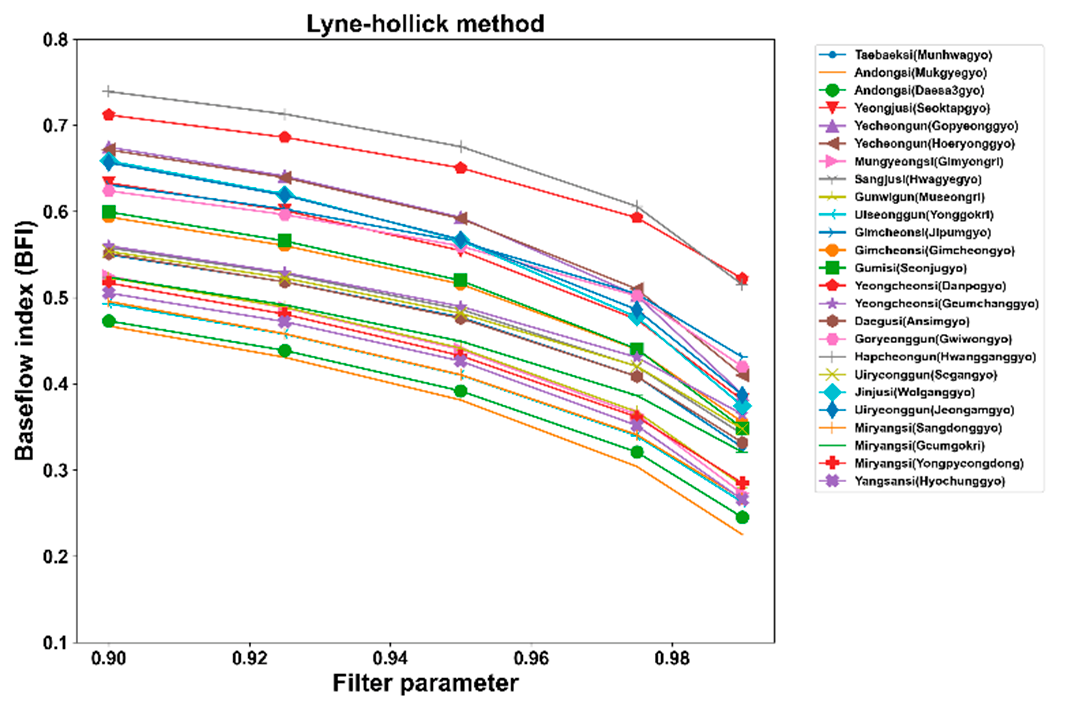
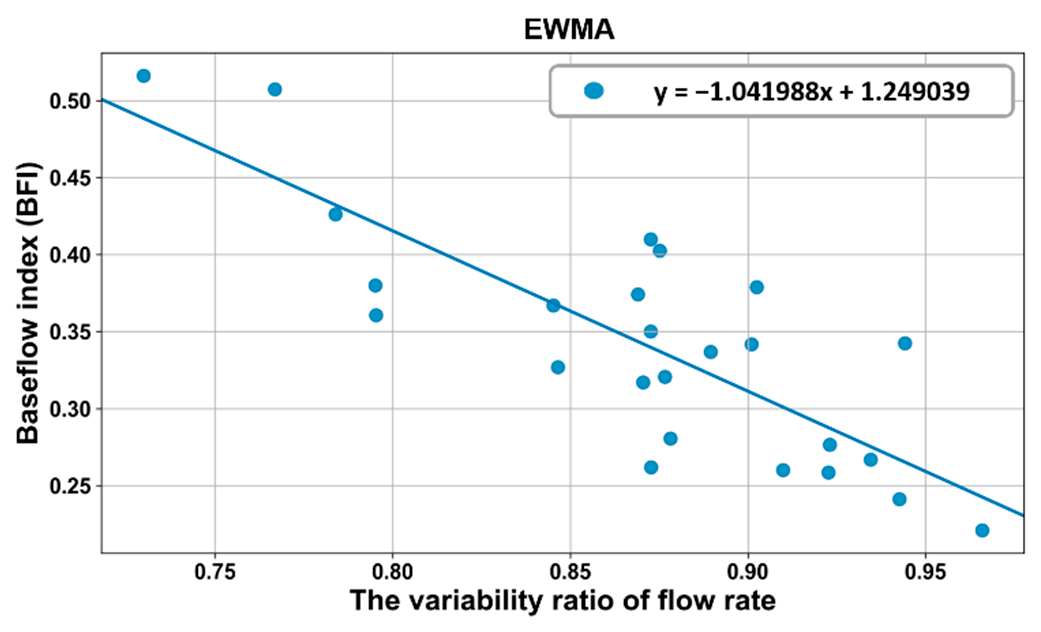
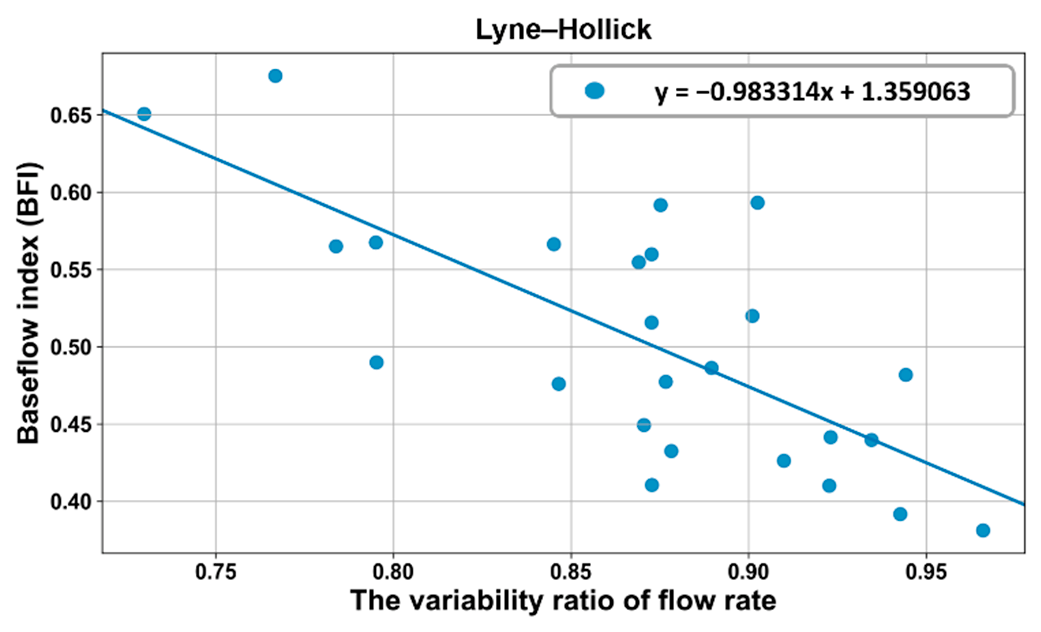
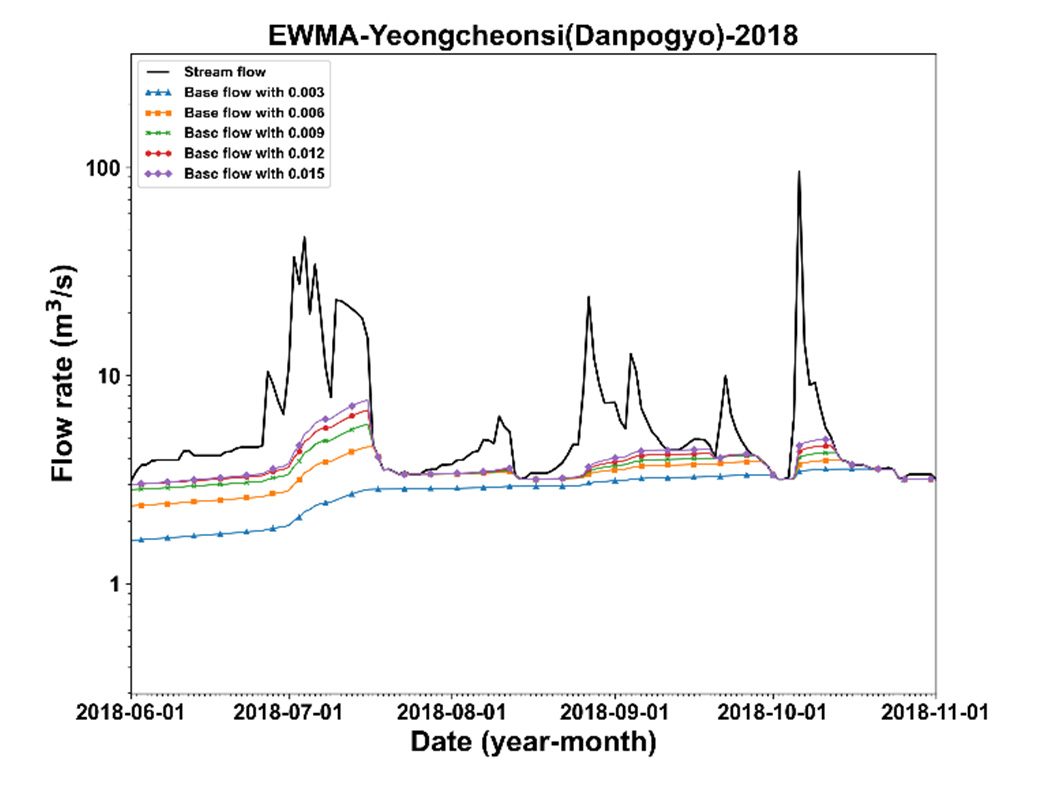
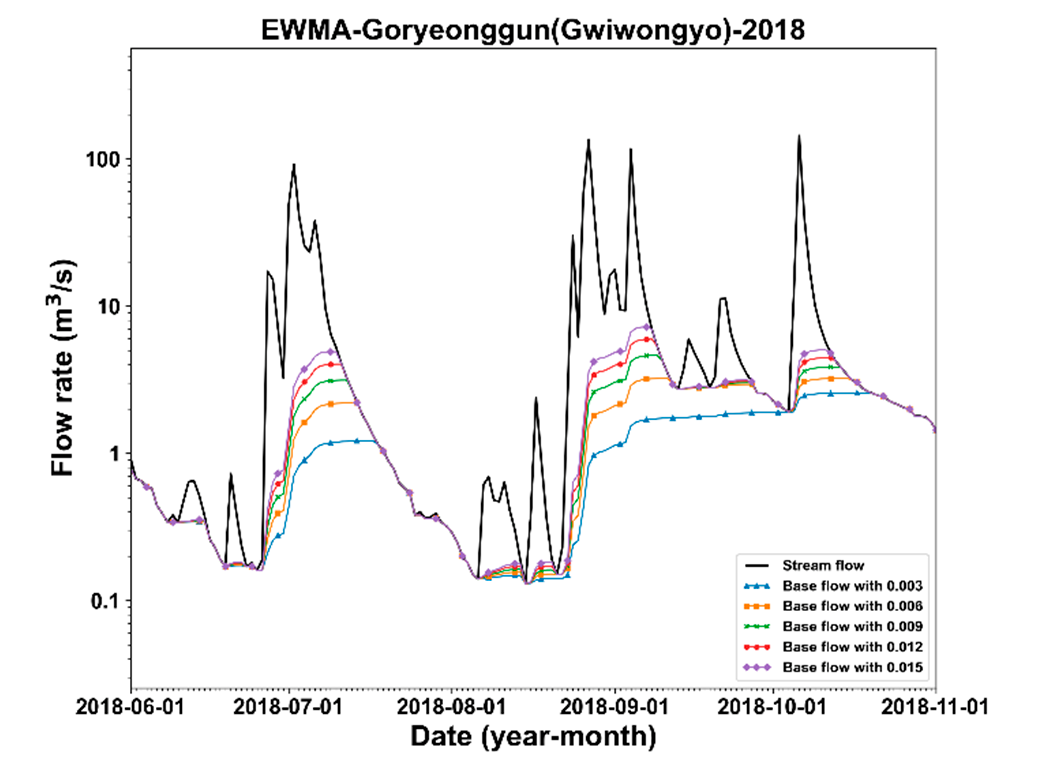
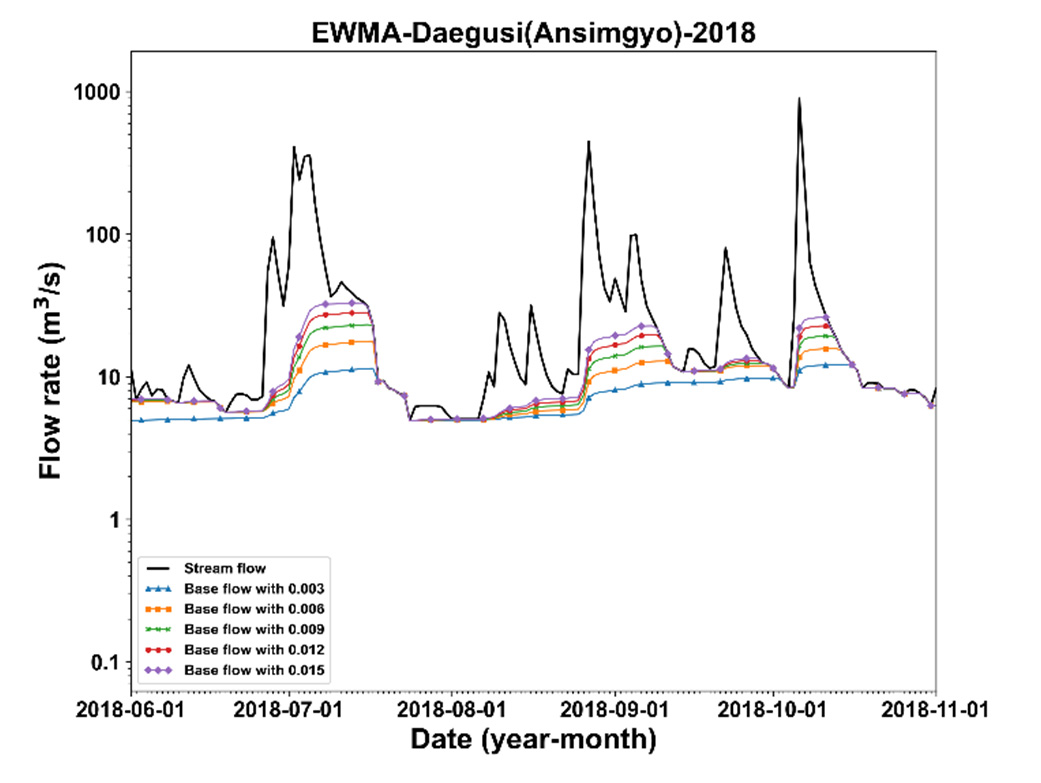
Figures & tables: Figures 2 and 3 (time-series separation by method and parameter) carry the key qualitative argument about dry-season failure; axes are labeled but no uncertainty bounds are shown. Figure 4 (BFI vs. filter parameter for all stations, four panels) is the central quantitative display; curves are distinguishable but overlapping and lack confidence intervals. Figure 6 (BFI vs. QD1,D9 scatter plots for EWMA and LH) supports the correlation claim but shows no regression line, confidence band, or p-value. Figure 7 (box-whisker of condition numbers) cleanly summarizes method-level sensitivity. No statistical significance is reported anywhere; no error bars appear on any figure.
Follow-up references: - Xie et al. [11] (J. Hydrol. 2020) — evaluated baseflow methods across the contiguous US; most directly comparable scope. - Eckhardt [17] (Hydrol. Process. 2005) — foundational recursive digital filter with two parameters; excluded here but widely used. - Nathan & McMahon [14] (Water Resour. Res. 1990) — operationalized the LH method; essential background. - Lott & Stewart [9] (J. Hydrol. 2016) — compares analytical and mass-balance (tracer) baseflow methods; provides the validation standard absent here.
Third pass — critique
Implicit assumptions: - Baseflow = low-frequency streamflow signal holds only where groundwater responds slowly; in flashy or karst catchments this assumption breaks down and the filter produces physically meaningless output. - The recession curve is treated as the correct baseline for dry-season baseflow, but it is itself an approximation; using it as an adequacy criterion is circular. - Uniform parameter ranges (0.9–0.99 for LH/Chapman/CM; 0.003–0.015 for EWMA) are borrowed from prior literature developed largely outside Korea; their coverage of the true parameter space for Korean monsoon rivers is unverified. - Stationarity of watershed behavior is assumed across the 8–12-year records; land-use change and dam operations are not discussed.
Missing context or citations: - The Eckhardt two-parameter method [17] is cited but excluded from comparison without quantitative justification; practitioners need guidance relative to this widely used method. - No engagement with tracer-based or recession-analysis-based baseflow estimates as a reference standard; Lott & Stewart [9] is cited in the introduction but not used for validation. - Xie et al. [11] evaluated similar methods in the US but a direct comparison of findings across climatic regions is not attempted. - Human regulation (weirs, reservoirs, irrigation withdrawals) in the Nakdong River is not mentioned as a potential confound on the streamflow signal.
Possible experimental / analytical issues: - The "appropriateness" criterion for recommending parameters rests on two subjective visual checks (dry-season recession fit; wet-season rise reasonability) with no objective metric, reproducibility standard, or inter-rater agreement reported. - All 25 stations are within a single monsoon-dominated Korean basin; results may not generalize to arid, nival, or temperate oceanic regimes where the frequency separation assumption may perform differently. - Correlation coefficients in Table 5 are reported without p-values, confidence intervals, or correction for multiple comparisons across four methods and four cases. - The condition number is evaluated at a single default parameter (midpoint of range); sensitivity at the recommended operating range endpoints is not separately quantified. - Station selection (25 of 60 by data-completeness criterion) is not shown to be unbiased with respect to watershed characteristics; if complete-record stations have different hydrological behavior this could skew the findings. - Data are stated as not publicly available, severely limiting reproducibility.
Ideas for future work: - Validate recommended parameter ranges against independent ground-truth (electrical conductivity or isotope-based) baseflow estimates at a subset of the 25 stations to replace the visual adequacy criterion with an objective one. - Apply the same sensitivity framework to non-monsoon climates (arid semi-arid, snowmelt-dominated, temperate maritime) to test whether the EWMA and LH recommendations hold across hydrological regimes. - Incorporate the Eckhardt two-parameter method into the sensitivity comparison and test whether the added parameter degree of freedom compensates for or amplifies the dry-season failure observed in Chapman and CM. - Develop an automated parameter-selection algorithm that minimizes the condition number while satisfying a dry-season recession constraint, eliminating reliance on subjective visual inspection.
Figures from the paper


Methods
- Lyne-Hollick filter
- Chapman filter
- Chapman-Maxwell filter
- exponentially weighted moving average (EWMA)
- baseflow index (BFI)
- condition number sensitivity analysis
- recession analysis
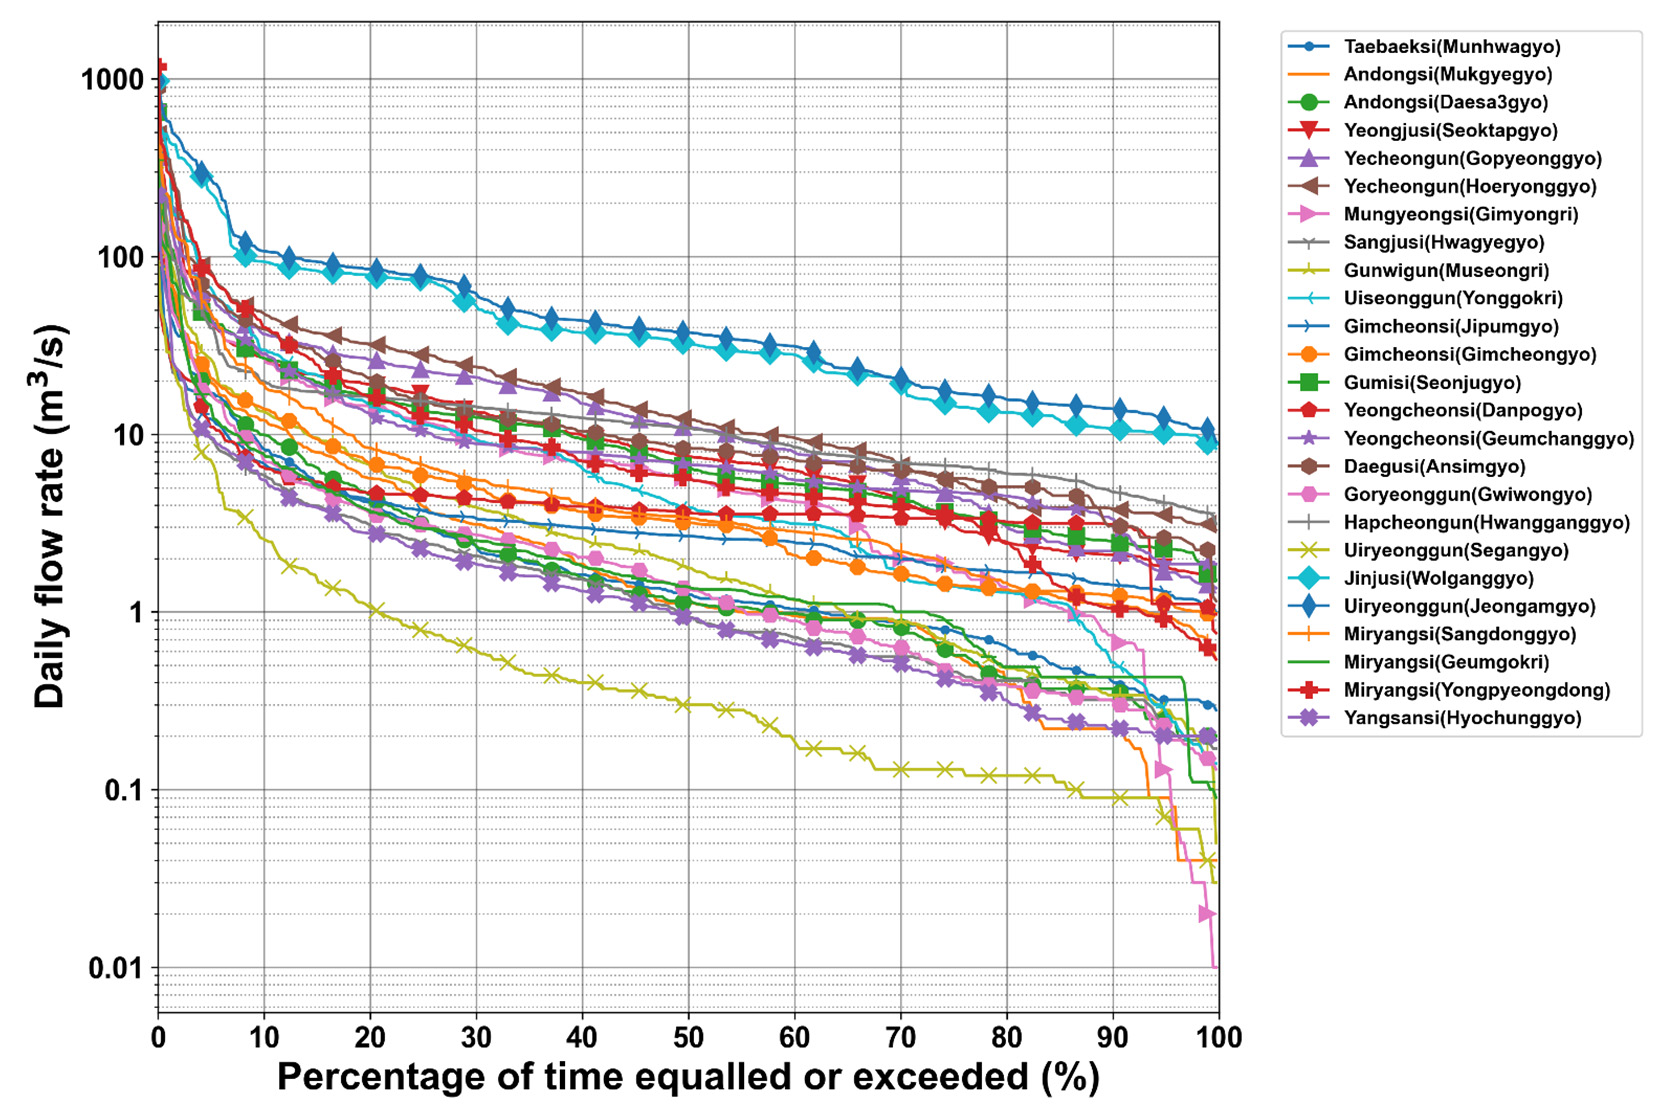
- flow duration curve analysis
Datasets
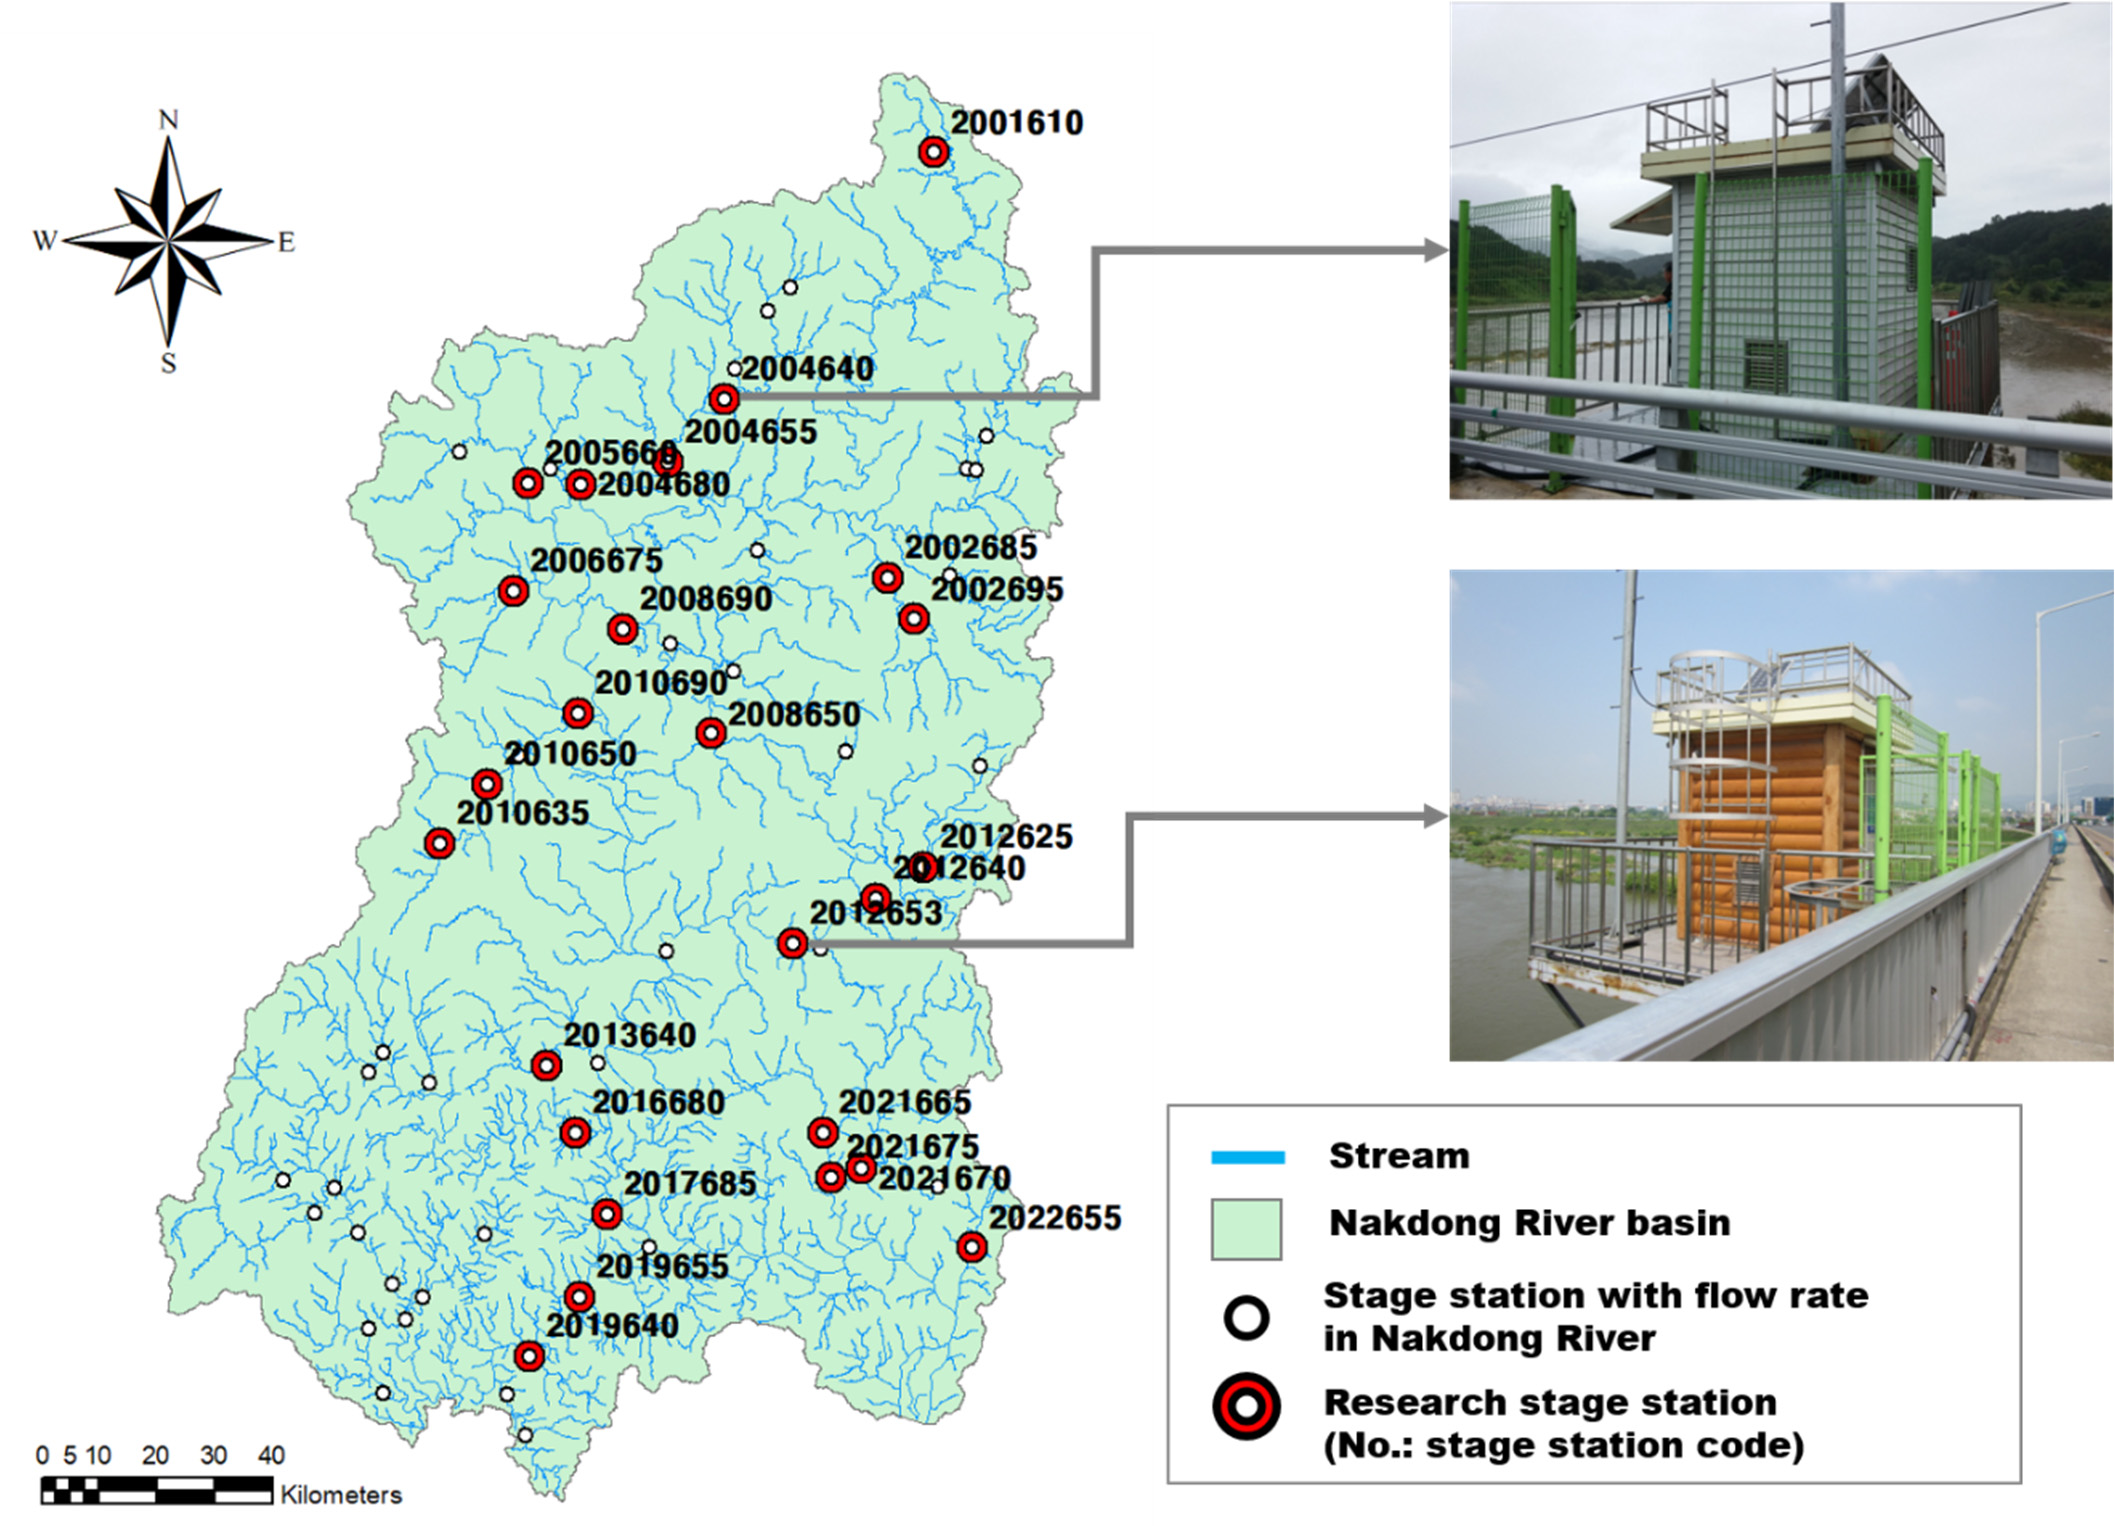
- 25 stage stations on the Nakdong River, Republic of Korea (8+ years of daily streamflow records)
Claims
- The Chapman and Chapman-Maxwell methods fail to properly separate baseflow during dry seasons, with the problem worsening as dry-season flow rates increase.
- The EWMA and Lyne-Hollick methods achieve reliable baseflow separation when appropriate filter parameters are selected.
- The Lyne-Hollick method is the most sensitive to filter parameter changes, while the EWMA method shows the least deviation in condition numbers across stations.
- The BFI calculated by the EWMA method is very highly correlated with dimensionless flow variation, indicating it best reflects river characteristics.
- Appropriate filter parameter ranges are 0.950-0.975 for the Lyne-Hollick method and 0.012-0.015 for the EWMA method.